
Welcome to Nightpixels, a data-driven visual blog about investing, business, and technology.
Nightpixels is published each week by Nightview Capital Research Analyst Cameron Tierney. Follow him here on X.
Sign up below to receive The Nightcrawler newsletter.
Online sports betting operator tax rates
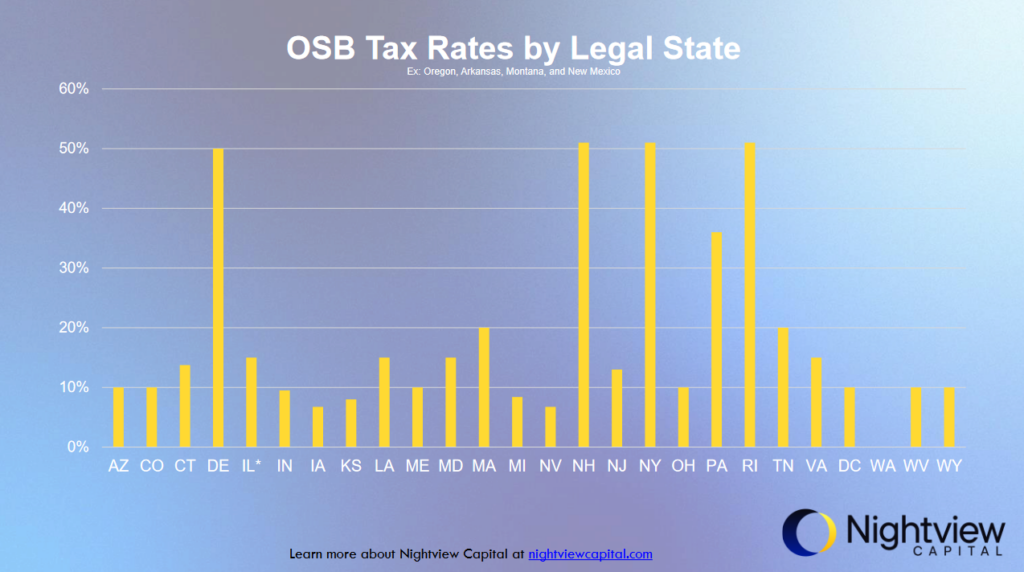
The Illinois state senate made waves this week by approving a tax increase for online sports betting operators in the state from 15% to a progressive tax system with an upper bound at 40%. It will take effect July 1 if the state’s House of Representatives approves the measure. This chart presents the tax rates for online sports betting across the various states where it is legal. Delaware (DE) and New Hampshire (NH) have some of the highest tax rates, exceeding 50%. In contrast, many states, including Virginia (VA) and Wyoming (WY), have much lower tax rates, often below 10%. As the online sports betting market matures, there will likely continue to be movement in tax rates across jurisdictions.
Source
The percentage of Americans with passports has 10x’d since 1989
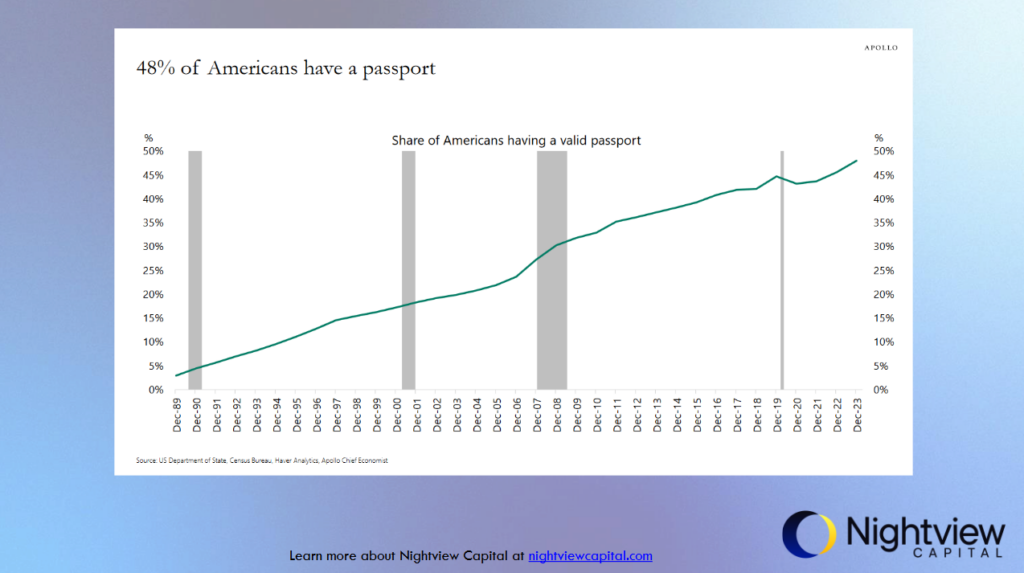
This chart shows the percentage of Americans holding a valid passport from December 1989 to December 2023. The share has steadily increased from around 5% in 1989 to nearly 50% in 2023. This upward trend highlights a growing interest among Americans in international travel and the increasing importance of passports as a travel document. The steady rise over the decades also reflects changes in travel behavior, globalization, and possibly more accessible international travel options.
Source
Semiconductor industry weighting in the S&P 500 has skyrocketed
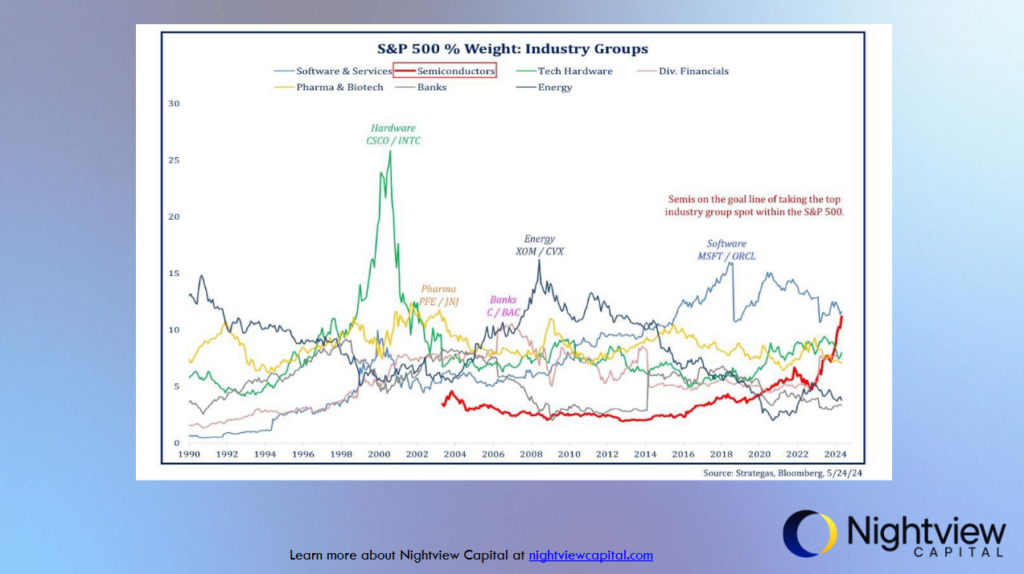
This chart shows the percentage weight of various industry groups in the S&P 500 from 1990 to 2024. Notably, the semiconductor sector (red line) has seen a massive rise, nearly overtaking software and services as the top industry group in the index. Tech hardware, represented by companies like Cisco (CSCO) and Intel (INTC), peaked around the dot-com bubble in 2000 but has since declined. In contrast, software companies like Microsoft (MSFT) and Oracle (ORCL) have steadily increased their influence since the Internet revolution. Perhaps the 2000 tech bubble is a bellwether for how the market prices new platform shifts. According to this hypothesis, investors might expect hardware/semis to accrue a significant amount of value in the beginning of a platform shift, with higher level abstractions like software services taking share over time as the platform matures. By all accounts, AI is the next platform shifts in computing.
Source
Foreign investment in US stocks is at an all-time high
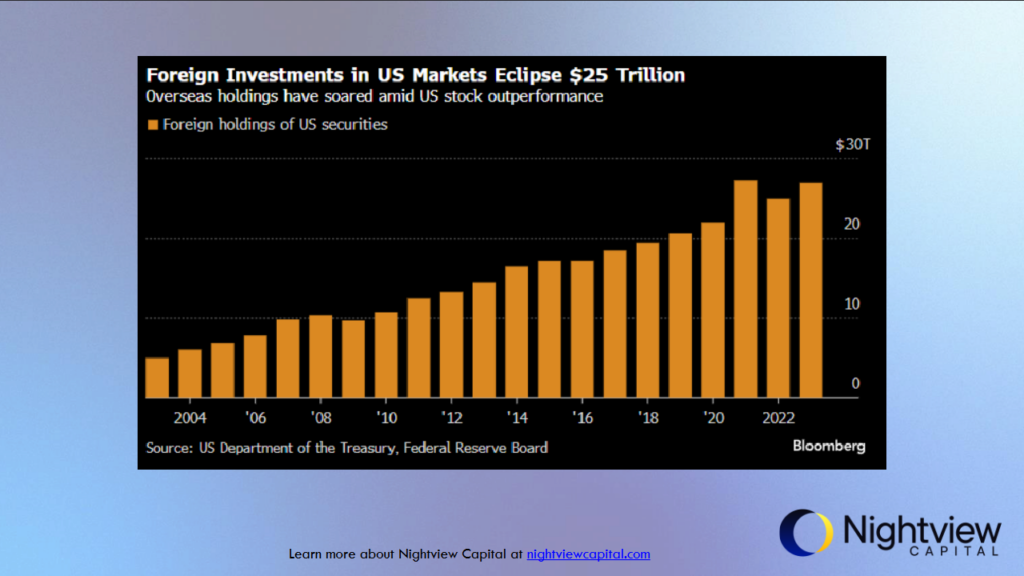
The US stock market has adopted the T+1 settlement cycle, reducing transaction completion time to one day, effective Tuesday under new SEC rules. Instead of trades settling in 2 days, they will now be settled in one. This aims to reduce financial system risks, mirroring the market speed from a century ago. The chart from Bloomberg shows the growth of foreign investments in US markets, highlighting that overseas holdings have soared to over $25 trillion. The switch to T+1 is significant due to the market’s size and complexity, especially for cross-border investments. Foreign investors will need to source dollars at an expedited rate in order to accord to the new settlement rules, which has raised some mild liquidity concerns among global investors.
Source
Pthalates in the food supply
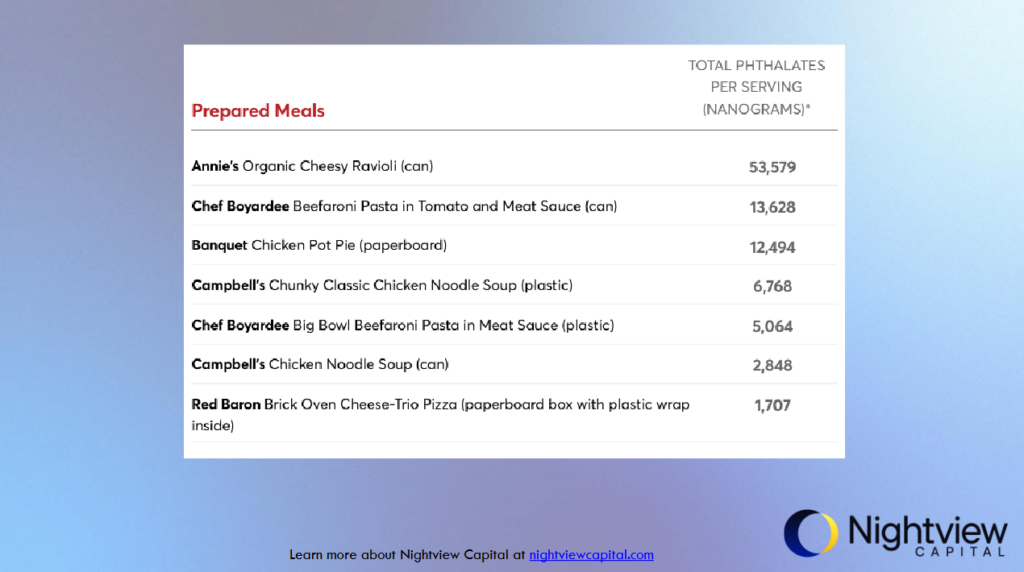
Consumer Reports has been publishing warnings on plastics and plastic-related particle in food since the 1990s. Recently, the organization published an analysis of total phthalates per serving (in nanograms) found in various common foods. This image shows pthalate levels in prepared meals. Annie’s Organic Cheesy Ravioli (can) has the highest phthalate content at 53,579 nanograms per serving, which is notable because many people buy this brand thinking they are making a healthy choice. Pthalates can be metabolized and excreted by our bodies, but high levels are carcinogenic. This full analysis from Consumer Reports indicates pthalates and plastics in general are largely unavoidable in the food system as it is currently structured.
Source
Global cruise industry returns to growth
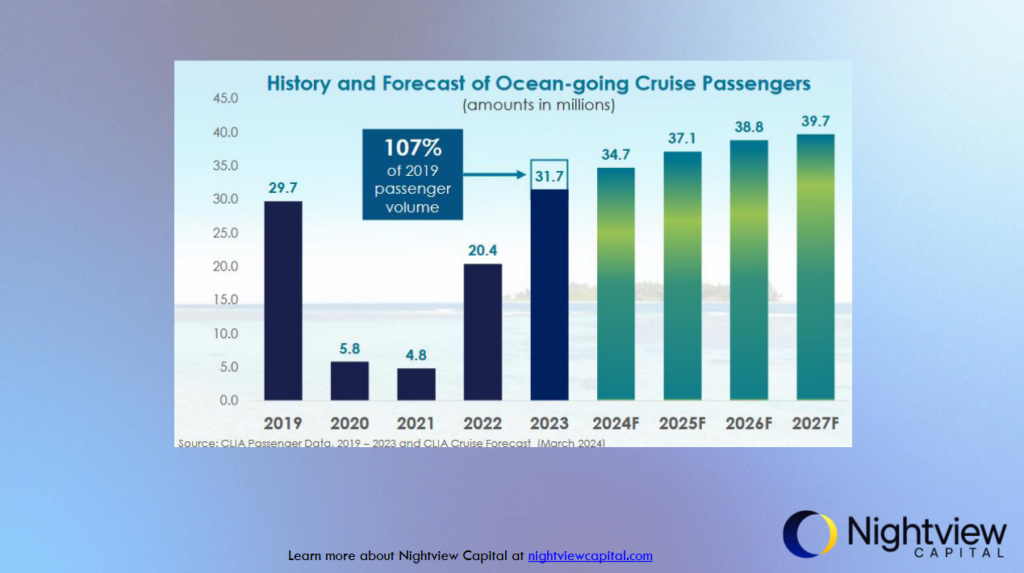
This chart from the Cruise Lines International Association illustrates the number of ocean-going cruise passengers from 2019 to 2023, with projections out to 2027. The industry saw a dramatic drop in 2020 and 2021 due to the COVID-19 pandemic, but a strong recovery is taking shape with passenger numbers from 2023 exceeding 2019 levels. Further growth is projected, with an estimated 39.7 million passengers by 2027. The full report from the CLIA also highlights changing demographics of cruise-goers, with an uptick in younger Millennials and Gen Z.
Source
The evolution of daily social interactions and solitude across a lifetime
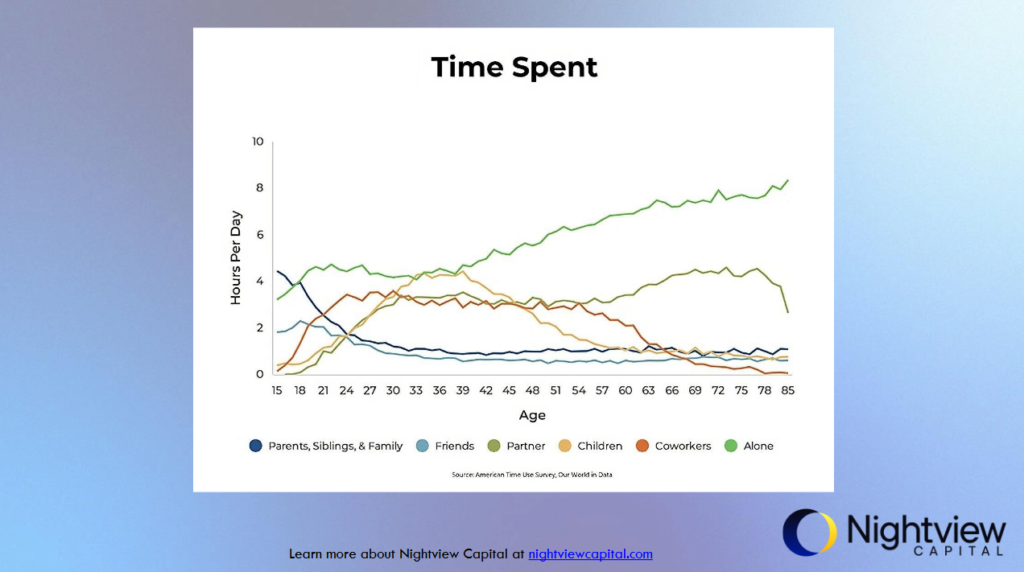
This chart visualizes how people allocate their time across various relationships and activities over their lifespan. It shows that time spent with parents, siblings, and family (dark blue line) declines significantly after the age of 20. Meanwhile, time spent alone (green line) increases steadily from age 15 onward, especially after retirement. Most notably, time spent alone is the highest level at almost all ages, contributing to the mental health epidemic in the U.S.
Source
